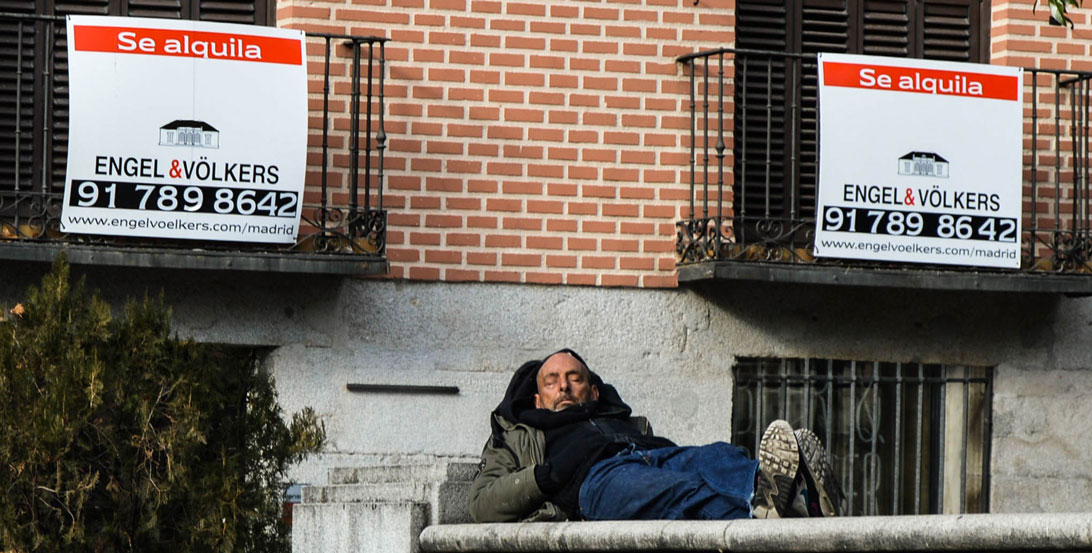
This project, developed during a data journalism workshop in Madrid, is an analysis of the rental market in Madrid and Barcelona. In 2016, the rental price increased by more than 15% in both Spanish cities and now keeps going up without control.
By comparing the rents per district and the average wage in both cities, this investigation tries to determine the proportion of salary one has to spend in home rental. An interactive map can be used to look where one could live without spending more than a third of his income, which is the ideal proportion to dedicate to housing.
We built an interactive tool which shows the user the amount of money he has left for all expenses after deducting the amount he spends on rent.
The resulting article exposes the causes of the changes in the rental market as well as the economic and social impact on tenants. The complete project is available here (in Spanish).
It was published in the Spanish newspaper El País in July 2017 and in Naciò Digital in August of the same year. It was awarded the first prize at the data journalism contest of the City of Madrid.
*header photo by Javier H.
*thumbnail photo by Pau Valiente
This is an open source project. You can find the code on this public repository.